
Browse the documentation
Performance Reports
Applies to: Tracker & affiliate users · Optional feature — available when your network has it switched on
The Performance Reports page pivots all your traffic around your offers — clicks, conversions, revenue, and, once you connect your ad spend, cost, profit, and ROI. It's where you find out which offers, sources, geos, and devices are actually working.
What this is#
One page with several tabs that all share the same date range and filters. Switch tabs to see the same traffic through a different lens — a quick health check, the core per-offer breakdown, click timing, geo, or device. Set the date range and filters once and every tab follows.
When you'll use this#
- Daily, to see whether campaigns are profitable.
- To decide which offers, sources, geos, or devices to scale or cut.
- To send a recurring summary to yourself or your team without opening the page.
Step by step#
- Open Performance Reports from the menu. It opens on a recent default window.

- Set the date range at the top. Every tab updates together.
- Apply filters to narrow all tabs at once (by offer type or a single offer).
- Switch tabs to change the lens:
- Overview — headline totals and trends for the period.
- Performance — the core per-offer breakdown with revenue, cost, profit, ROI.
- Clicks — click volume and timing.
- GEO — traffic and conversions by country.
- Devices — traffic and conversions by device type.
- Read the numbers (see below), then act — scale the winners, cut the losers.
Options reference#
Metrics#
| Metric | What it means |
|---|---|
| Clicks | Visits that went through your tracking links. |
| Conversions | Paid actions completed (see Postbacks). |
| Revenue (Earned) | What your conversions earned. |
| Cost | What you paid for the traffic — populated once you connect Ad Spend. |
| Profit | Revenue minus cost. |
| ROI | Return on ad spend, as a percentage. |
| EPC | Earnings per click — average revenue per click. |
| CR | Conversion rate — share of clicks that converted. |
Tabs#
| Tab | What it shows |
|---|---|
| Overview | Totals and trends — a quick health check. |
| Performance | Metrics per offer, with revenue, cost, profit, ROI. |
| Clicks | Click volume and timing. |
| GEO | By country. |
| Devices | By device type. |
Filters#
| Filter | Use it to |
|---|---|
| Offer type | Limit the report to one category / vertical. |
| Offer | Focus on a single offer. |
Combine filters with tabs — filter to one offer, then switch to GEO to see which countries convert best for it, or to Devices to see where it wins.
Example#
Find the geo that's carrying an offer#
- Filter Offer to a single nutra offer.
- Open the GEO tab and sort by ROI.
- If one country is far ahead, build a country-targeted tracking link or split your ad targeting to lean into it.
Reading the numbers#
- EPC and CR measure how efficiently traffic converts, independent of volume — the fair way to compare offers or sources.
- Profit and ROI only become meaningful once cost flows in from Ad Spend; until then reports show revenue-side metrics only.
- Traffic that clicked but hasn't converted yet still shows under Clicks — a low CR early in a campaign may just mean conversions are still landing.
Scheduled reports#
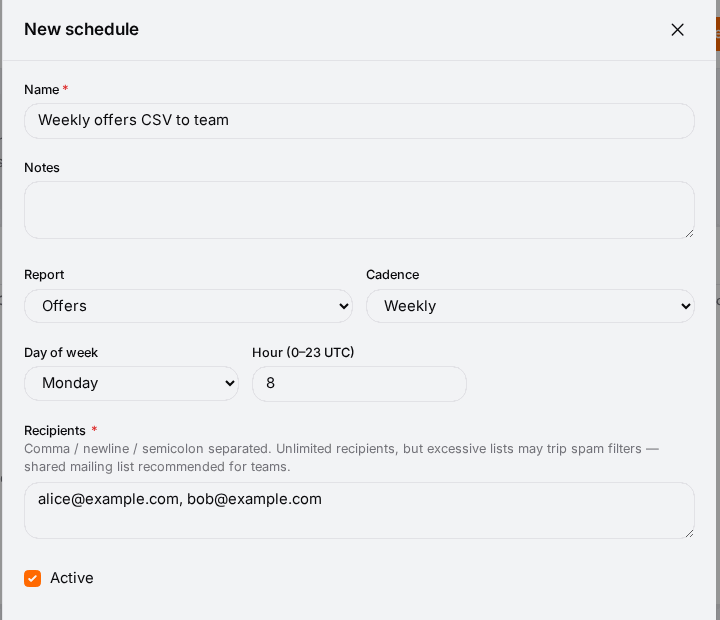
Rather than opening the page each day, schedule a report to be emailed to you or your team on a daily, weekly, or monthly cadence, delivered as a CSV attachment. Set the recipients, cadence, and time on the report-scheduling page.
The tracker dashboard#
The tracker's start page is a configurable dashboard, like the main dashboard, set to tracker panels: Tracker Overview, Offer Stats, Tracking Link Stats and Source Stats. The first time you open it, a default tracker layout is set up for you; add, remove, resize and reorder panels the same way as on the main dashboard. If your account also advertises or publishes, the tracker dashboard keeps showing only tracker panels.
Tracker settings#
Settings (tracker menu) has three parts:
- General — your Tracking domain (where every tracking-link click lands for processing), Main currency and Timezone. These are set by your network and are read-only here.
- Tracking link options — whether Direct tracking (no-redirect mode) and Allow user-bound custom domains are available on your network. Also read-only.
- Custom parameters — the part you edit. Your tracking links can carry 11 passthrough slots; give each one a readable name (for example placement or creative) and it becomes a column with that name in the Custom Params report. Under Names for, keep All sources (report columns) to name a slot everywhere, or pick a source to give a slot a different name only while building that source's tracking links. Each slot shows how many values arrived in the last 30 days, or No data yet. Click Save.
Tips#
- Give tracking links and sources clear names — reports are only as readable as the labels feeding them.
- Compare sources for the same offer on EPC, not click volume.
- Widen the date range when conversions lag (deposits and installs can land days after the click).
- Connect Ad Spend early so profit and ROI are populated from day one.
Troubleshooting#
| Symptom | Likely cause | Fix |
|---|---|---|
| Cost / profit / ROI columns are empty | No ad spend connected | Connect the source under Ad Spend. |
| Low CR on a new campaign | Conversions still landing | Widen the date range; give delayed events (deposits, installs) time. |
| Conversions missing entirely | Postback wiring broken | Check Postbacks & Conversions and run the callback test. |
| Numbers don't match the ad platform | Different attribution windows / time zones | Compare like-for-like date ranges; expect small differences. |
Related#
- Offers — what the reports pivot around
- Postbacks & Conversions — where conversions come from
- Ad Spend & Cost Tracking — adds cost, profit, and ROI
- Tracking Links — the links that generate the traffic
- How to read conversion stats per offer, source and sub-ID — step-by-step guide
- Player LTV (iGaming) — lifetime value per player
- Conversions Log and Suspicious Conversions — every conversion and the ones on hold
- Tracker Rules — pause losing sources automatically