
Browse the documentation
Advertiser Statistics
Applies to: Advertisers
The statistics report shows how your campaigns are performing. You choose a date range, group the data the way you want, and drill down to find what's working — and what to cut with filters.
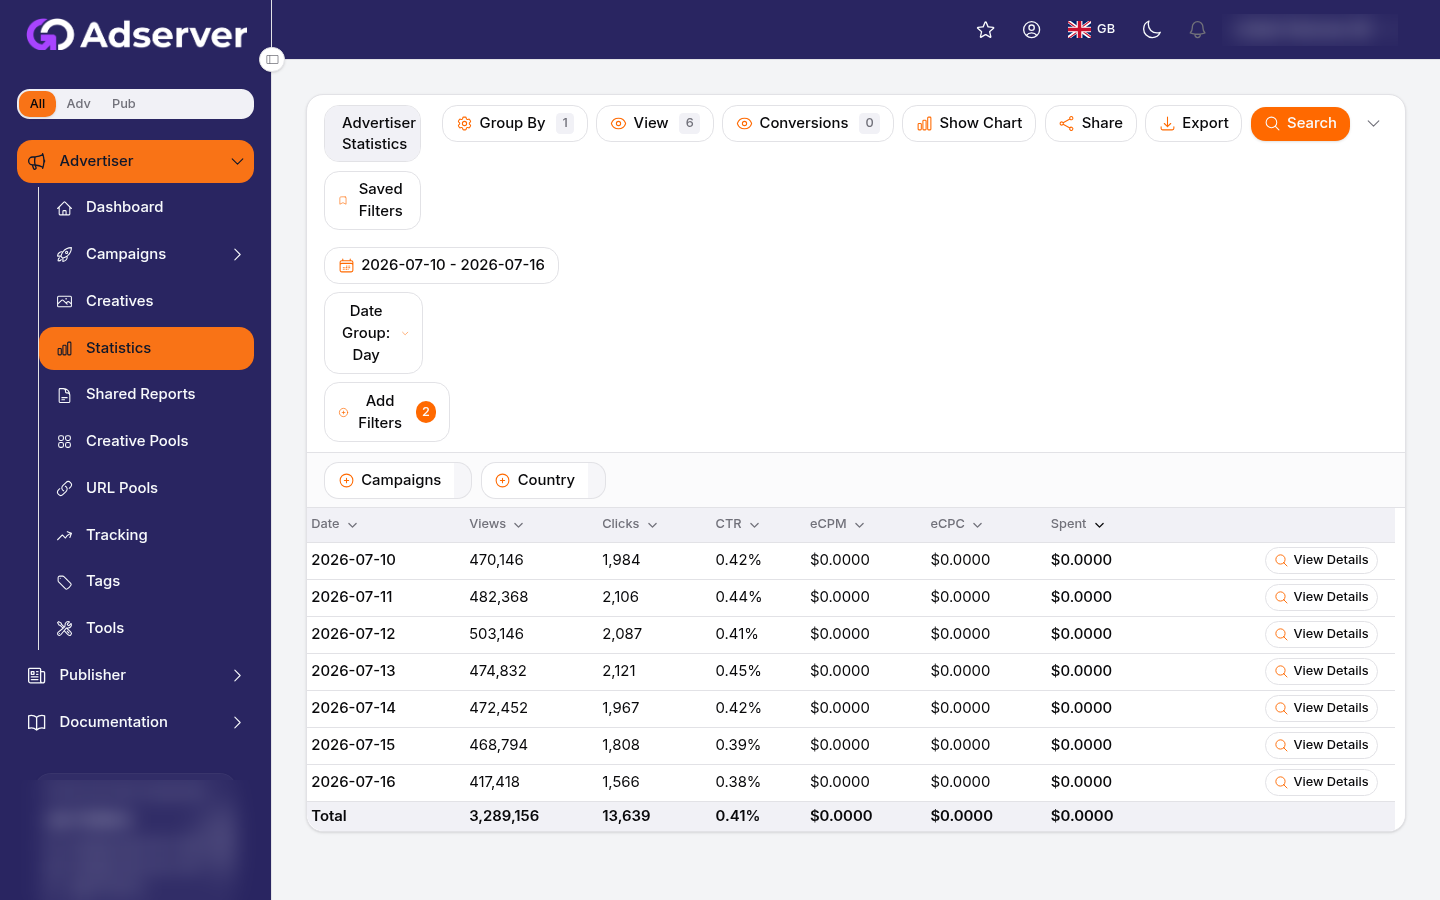
Advertiser statistics — set the date range and group-by, then read the table of views, clicks, CTR and spend.
What this is#
A flexible report over all your advertising data. You pick a time range, one or more group-by dimensions (campaign, country, domain, device…), and the metrics you want to see (views, clicks, spend, conversions and more). The result is a table you can sort, filter and export.
When you'll use this#
- Daily/weekly, to see which campaigns spend and perform.
- To find the domains, sub-IDs or countries wasting budget so you can exclude them.
- To compare creatives (group by Ad) or evaluate a bid ruleset (group by Bid Ruleset / Bid Rule).
- To export a report for a spreadsheet or a client.
Step by step#
- Open Statistics from the menu.
- Set the Date Range — a preset (today, yesterday, last 7/30 days, this month) or custom start/end dates. Every total and breakdown is calculated for that range.
- Open Group By — a multi-select of dimensions — and tick the ones you want. Tick just one for a simple breakdown, or several to cross-tabulate (e.g. Country + Campaign).
- Separately, choose a Date Group (Day, Day/Hour, Week, Month, or Summary) if you want the data bucketed over time.
- Open Metrics and pick which columns to show.
- Optionally apply filters to narrow the report to a subset before you read it.
- Read, sort by any column, and Export to CSV if you need it elsewhere.
Options reference#
Date Group#
| Grouping | What it shows |
|---|---|
| Summary | One combined total for the whole range. |
| Day | One row per day. |
| Day / Hour | One row per hour within a day. |
| Week | One row per week. |
| Month | One row per month. |
Group-by dimensions#
| Dimension | Breaks the data down by |
|---|---|
| Date | Time bucket (set by the Date Group control above). |
| Campaign / Campaign ID | Each of your campaigns. |
| Ad / Ad ID | Each creative. |
| Country | Visitor country. |
| OS | Operating system. |
| Browser | Browser. |
| Device Type | Desktop / mobile / tablet. |
| Ad Type | The ad format. |
| Selling Type | How the inventory was sold. |
| Adzone | The placement the ad ran on. |
| Domain / Website | The site the ad ran on. |
| SubID / SID1–SID5 | Your traffic sub-IDs. |
| Publisher | The publisher supplying the traffic. |
| Bid Ruleset / Bid Rule | Which bid rule drove the bid (RTB). |
Combine a Date Group with a dimension to answer questions like "how did each country do per day".
Metrics#
| Metric | What it means |
|---|---|
| Views | How many times ads were shown. |
| Clicks | How many clicks you received. |
| CTR | Clicks divided by views. |
| eCPM | Effective cost per 1,000 impressions. |
| eCPC | Effective cost per click. |
| Spent | What you were charged. |
| Conversions / Sign ups | Recorded conversions / registration-type conversions. |
| Refunds | Amounts refunded (e.g. filtered traffic). |
Traffic-quality (bot) indicators#
Where your network tracks them, you can add quality columns so you can judge the inventory you're paying for:
| Indicator | What it flags |
|---|---|
| Bot Views / Bot Clicks (and %) | Views/clicks attributed to bots. |
| Bot: Click | Devices or IPs clicking far more often than people do. |
| Bot: Impression | IPs loading many ads without ever clicking. |
| Bot: Conversion | IPs producing repeated conversions. |
| Bot: Web | Browsers that identify themselves as crawlers or automated tools. |
| Bot: High Freq | One IP requesting an unusually large number of ads in a few hours. |
| Bot: Artificial IP | Addresses that don't look like a normal consumer connection (unknown location or provider, known proxies). Most data-centre and VPN traffic lands here. |
| Bot: Unknown | An older catch-all; new traffic is not tagged with it. |
Each bot view or click carries one reason only, so the columns add up rather than overlap.
Filtering, saved filters and export#
- Filters narrow the report to a subset before you read it — a single campaign, one country, one device. Filters combine, so you can look at (say) mobile traffic in one country for one campaign.
- Saved filters let you store a filter/grouping combination you use often and re-apply it later, so you don't rebuild the same report each time.
- Export sends the current report to CSV, reflecting your current date range, grouping, filters and columns.
Example#
Finding and cutting wasted spend. Your "Push — US — App installs" campaign spends steadily but installs are flat:
- Set the date range to Last 7 days.
- Group By → Domain (single dimension), and add the Spent and Conversions columns.
- Sort by Spent descending. Three domains sit at the top with real spend and zero conversions.
- Copy those domains, open Filters, create a Domain Exclude filter, and attach it to the campaign. See Targeting & Filters.
- Re-run next week — the wasted spend is gone and your effective CPI drops.
Comparing creatives. You want to know which of three banners earns its keep:
- Filter to the one campaign.
- Group By → Ad, show Views, Clicks, CTR, Spent.
- One banner has a far higher CTR at similar spend. Raise its weight and lower the others'.
Tips#
- Start with a Summary grouped by Campaign to see which campaigns spend and perform, then drill into the weak ones by Country, Domain or SubID.
- Watch CTR and eCPM together — cheap views that never click aren't a bargain.
- When a domain or sub-ID shows spend with no results, add it to an exclude filter — this report plus filters is your main tuning loop.
- Add the bot columns occasionally to sanity-check inventory quality; a high bot share explains spend without results.
- Save the reports you run every week as saved filters so they're one click away.
Troubleshooting#
| Symptom | Likely cause | Fix |
|---|---|---|
| Report is empty | The date range has no data, or a filter is too restrictive. | Widen the date range and clear filters. |
| Numbers look lower than expected | The range or grouping isn't what you think, or timezone/day boundaries differ. | Double-check the date range and grouping; try Summary first. |
| Spend but no conversions on a source | That inventory isn't converting (or conversion tracking isn't firing). | Group by Domain/SubID, exclude the dead sources, and verify your conversion tracking. |
| A metric column is missing | It isn't selected, or your network doesn't track it. | Add the column from the metric picker; some indicators are network-dependent. |
| Export doesn't match the screen | The export reflects the current range, grouping and filters. | Set the report exactly as you want it, then export. |
Related#
- Targeting & Filters
- Bid Rules
- Ads & Creatives
- Offers
- Campaigns Overview
- Conversion Tracking & Retargeting
- Campaign Groups
- Source Optimizer
- How to read your campaign statistics — step-by-step guide
- How to share a report — step-by-step guide