
Browse the documentation
Publisher Statistics
Applies to: Publishers
The statistics report shows how your ad zones are performing — views, clicks, and earnings over time — with filters and breakdowns so you can find what works and what doesn't. All money figures reflect your publisher earnings.
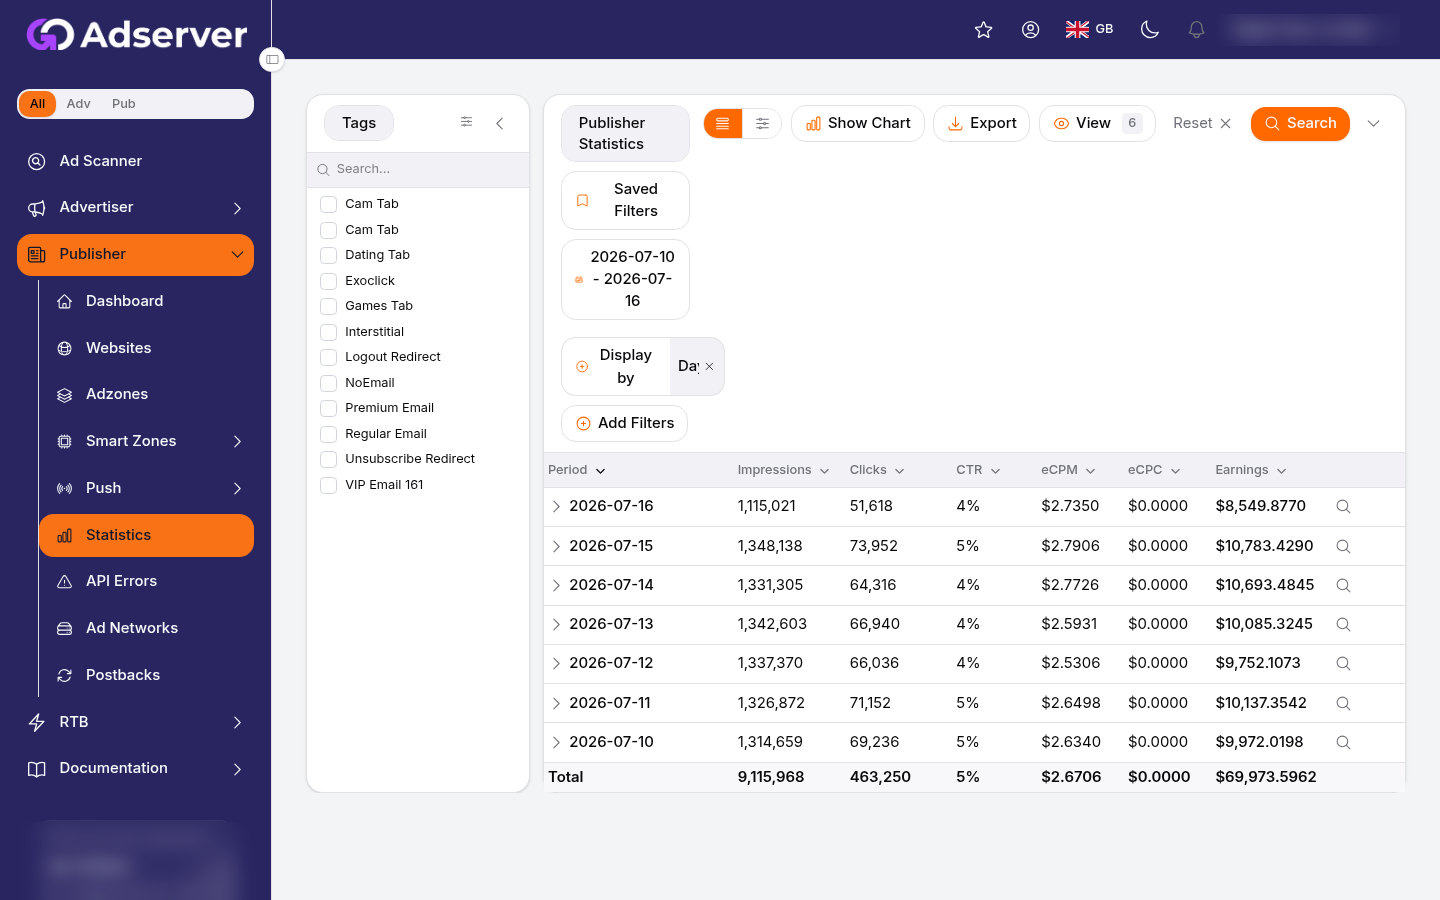
Publisher statistics — group by period (or zone, country, device), then read impressions, eCPM and earnings.
What this is#
This is your reporting dashboard. You choose a date range and a way to group the rows (by day, week, month, and so on), optionally narrow the data with filters, and read the resulting table and totals. You can drill into any row to break it down by zone, country, device, and more, and export the whole thing to a spreadsheet.
When you'll use this#
- To check how much you earned over any period.
- To find your best (and worst) zones, countries, and traffic sources.
- To spot problems — a drop in fill, a surge in bot traffic, a zone earning nothing.
- To export numbers for your own records or accounting.
Step by step#
- Open the Statistics page from the publisher menu.
- Set the from and to dates for the period you want.
- Choose a grouping (Day is the default) — see the table below.
- Add any filters to narrow the data (website, zone, country, device, and so on).
- Read the table and the totals row at the bottom.
- To drill in, expand a row (or open the details view) and pick a breakdown dimension.
- Use Export to download the current view as a CSV.
- Optionally, save the whole setup as a named preset with Saved filters so you can re-apply it in one click.
Options reference#
Date grouping#
| Grouping | Shows |
|---|---|
| Day | One row per day (the default). |
| Hour | Hourly detail within the range. |
| Week | One row per calendar week. |
| Month | One row per month. |
| Summary | A single combined row for the whole range. |
Filters#
Combine any of these to narrow the report:
| Filter | Limits results to |
|---|---|
| Ad type | A single ad format (banner, native, pop, video, …). |
| Website | One of your websites. |
| Ad zones | Specific zones (often after picking a website). |
| Selling type | CPC, CPM, CPA, Flat Rate, or Smart Zones. |
| Device type | Desktop, mobile, and other device categories. |
| Country | A single country. |
| Tags | Your own zone labels, to report on a group of zones at once. |
Metrics (columns)#
Each row and the totals include:
| Metric | Meaning |
|---|---|
| Views / Impressions | Ad views served. |
| Unique views | Views from distinct visitors. |
| No ads | Requests where no ad could be filled. |
| Clicks | Clicks on served ads. |
| CTR | Click-through rate — clicks ÷ views, as a percentage. |
| eCPM | Effective earnings per thousand views. A quick measure of how well a zone monetises. |
| Conversions | Completed actions (shown as conversion A / B / C where applicable). |
| Bot views / bot clicks | Traffic identified as non-human, reported separately so it doesn't inflate your real numbers. |
| Earned | Your earnings for that row. |
Breakdown dimensions (details)#
Expand a row or open the details view to break the numbers down by one dimension:
| Dimension | Answers |
|---|---|
| Ad zone | Which zones drove the traffic. |
| Country | Where your visitors were. |
| OS | Which operating systems they used. |
| Browser | Which browsers they used. |
| Domain | Which sites the ads ran on. |
| Sub ID | Your own tracking sub-IDs. |
Each breakdown carries the same metrics as the main table.
Reading the numbers#
- eCPM is your headline efficiency number. Two zones with similar views but very different eCPMs tells you where to focus.
- No ads high relative to views means poor fill — often a floor price set too high, or narrow targeting on the zone.
- CTR that's unusually high alongside high bot clicks can indicate low-quality traffic.
- Bot views/clicks are separated out on purpose; judge your real performance on the human numbers.
Example#
Finding a weak zone. Nadia sets the range to last month, groups by Day, and filters to one website. The totals look fine, but she expands a day and breaks it down by Ad zone — one zone shows lots of "No ads". She opens that zone, sees its country floor price is too high, lowers it, and fill recovers over the next few days.
Monthly export for accounting. At month-end, Hugo sets the range to the full month, chooses Summary grouping, and clicks Export to get a single-row CSV of totals for his records.
Tips#
- Start broad (all zones, Day grouping), then add filters to zoom in on anything odd.
- Save the filter combinations you use often as Saved filters to skip the setup next time.
- Compare eCPM by ad zone and by country to decide where to add or improve placements.
- Watch the bot columns — a spike is worth investigating before it affects your account standing.
- Exports respect your current date range and filters, so set those before exporting.

Exporting and saved filters#
- Export to CSV. The Export action downloads the current report — main table or a breakdown — as a CSV that opens in any spreadsheet. It respects your active date range, filters, and the columns shown.
- Saved filters. Save a filter combination as a named preset. It stores your date grouping, selected websites, zones, ad types, selling types, devices, countries, and tags, so you can re-apply the whole setup in one click — and delete it when you no longer need it.
Troubleshooting#
| Symptom | Likely cause | Fix |
|---|---|---|
| Report is empty | Date range has no data, or filters are too narrow. | Widen the dates and clear filters, then narrow again step by step. |
| Earnings look lower than expected | High "No ads" (poor fill) or aggressive floor prices. | Break down by ad zone, then loosen floors/targeting on weak zones. |
| Numbers don't match another tool | Different date ranges, timezones, or bot handling. | Confirm both use the same range; remember bot traffic is reported separately here. |
| CTR looks abnormally high | Possible bot activity. | Check the bot columns and the traffic Domain breakdown. |
| Export downloads nothing/empty | Filters excluded all rows before exporting. | Load a non-empty report first, then export. |
Related#
- Ad Zones — the placements these numbers come from.
- Websites — filtering stats by property.
- Earnings & Payouts — turning earnings into a payout.
- Getting Your Ad Code — making sure zones are live and filling.
- Visitor Analytics — audience numbers to compare against fill.
- Smart Zones — routing traffic to outside networks and reading the split.
- Push Ads — push subscriber and revenue reporting.
- How to see what your sites and ad zones earn — step-by-step guide
- Mini Network — partner sites and their earnings